Capacity Planning
Overview
This document provides general guidelines on how to plan initial server capacity, optimize system resources, and make provisions for system and environmental growth.
In general, capacity should be planned to handle average peak load. Resolve recommends that average peak load should be three times of the average load of the system. This is necessary for maintaining reasonable system performance when the highest peak load occurs.
As Resolve Actions Pro resource utilization characteristics may change, the system should be regularly monitored. The purpose of this monitoring is to detect shift in resource utilization so that acceptable performance levels are maintained. Additionally, it allows for more precise adjustment plans for any configuration or resources to increase or decrease capacity. Moreover, the initial architecture may not be the optimal architecture as the portfolio of Runbooks grows. Each Runbook make up utilizes different Actions Pro resource, so the architecture may need to be adjusted to avoid bottlenecks.
Factors That Affect Resource Utilization
The performance of a system depends on hardware and software configuration, network configuration, database design, and more. For Actions Pro, there are five key factors that affect resource utilization.
Burst Rate of ActionTasks
As incidents are received by Actions Pro, ActionTasks will be executed to resolve them. An ActionTask contains one or more commands that are executed against a target system. The number of ActionTasks implemented depends on the Runbook design. A high burst rate could result in a load that can be temporarily greater than the system capacity. As a result, a negative affect on the response time, Runbook synchronization, and performance should be expected. We typically observe that peak load is three to four times of the average load, and advise our customers to plan capacity based on a multiple of average load, what is termed the average peak load.
Number of Concurrent Users
As the number of concurrent user's increases, the system spends more resources handling user interactions. It places more load on the system, particularly RSView, and is an addition to the load initiated by user to resolve incidents. If you expect high number of concurrent users then plan for extra capacity to be utilized.
Total Events Processed
The total events processed over a period of time determines the amount of records, such as worksheets or social feed, which are generated and saved to the internal database. The amount of data in the internal database affects the response time of queries and the speed of backup and restore. Over time, the records could build up and require additional disk space.
Runbook Make Up
The Runbook make-up depends on the nature of the work. For example, organizations may set up a Runbook with a different focus. Some organizations may have a small number of highly complex Runbooks that each contain hundreds of ActionTasks. This will place heavy load on the RSControl. Other organizations may have hundreds of simple Runbooks, each set up to test a particular service, which will place heavy load on RSRemote. Additional information on this topic is available in the Optimization, Monitoring, and Future Planning section of this document.
Load from Ancillary Tasks
Ancillary tasks, such as archiving or import/export, can also have an impact on performance, if a task is not configured and scheduled properly. For example, archiving records during peak hour could slow down system performance and push the memory utilization to the limit, leading to unnecessary reboot. It is recommended that ancillary tasks are run during off hours. The additional load from these tasks should be taken into account when planning system capacity.
Capacity Planning
Capacity is determined by the total CPUs, memory, and disk space available to run Actions Pro, and is bound by the most limiting factor. Listed below are some representative configurations and guidelines.
Standard Configuration
The Standard configuration, by default, runs on a single host and is designed to handle a smaller load (usually has lower number of CPUs, typically 4). It may lack some advanced features such as High Availability, and therefore caps the maximum system throughput because no additional resources can be added to scale up. While the system may be efficient by itself, its potential is limited.
Performance Test Examples
The below test results (Tables 1 and 2) are based on simulated users performing the following actions:
- Login and get User
- Login, execute and get Results Macro
- Login and view Custom Form
All concurrent users were split between the above actions and ATs executed performed actions, such as accessing server, list directories, etc.
In the following setup, all Actions Pro components are deployed on a single VM (hardware specs: 4 vCPU, 32GB RAM, 40GB storage).
Table 1: Application Performance – Standalone Configuration
| Standalone Actions Pro(1x VM) | Actions Pro 6.3 | Actions Pro 6.4 | ||
|---|---|---|---|---|
| Concurrent users | Delay (API calls) | Total calls | Total calls | |
| Login and get User | 15 | 5 sec | 15558 | 10429 |
| Login, execute and getResultsMacro | 30 | 5 sec | 3374 | 20692 |
| Login and view custom form | 30 | 5 sec | 15396 | 20863 |
Actions Pro cluster setup on 3 VMs (hardware specs: 8 vCPU, 32GB RAM, 40GB storage)
Table 2: Application Performance – Cluster Configuration
| Actions Pro Cluster(3x VMs) | Actions Pro 6.3 | Actions Pro 6.4 | ||
|---|---|---|---|---|
| Concurrent users | Delay (API calls) | Total calls | Total calls | |
| Login and get User | 50 | 5 sec | 32104 | |
| Login, execute and getResultsMacro | 50 | 6 sec | 11711 | 28708 |
| Login and view custom form | 50 | 5 sec | 34313 | 34645 |
Table 3: Total number of Runbooks executed during tests
| Deployment | Actions Pro 6.3 | Actions Pro 6.4 |
|---|---|---|
| 1x VM | 3374 | 20692 |
| 3x VMs (Cluster) | 11711 | 28708 |
Table 4: JVM memory allocation per component
| Component | Xms | Xmx |
|---|---|---|
| RSSEARCH | 8192 | 8192 |
| RSVIEW | 2048 | 2048 |
| RSCONTROL | 2048 | 2048 |
| RSREMOTE | 2048 | 2048 |
| RSMGMT | 512 | 512 |
- It is recommended that no other components are setup on the RSMQ server for high throughput.
Summary
The executed tests are specific to system on which they were performed. With other Runbooks there will be different results.
The important conclusions from the above tests are:
- RSControls and RSRemotes scale and distribute load in a perfect manner by each node getting the same amount of tasks.
- The bottleneck in the example case is the network traffic to the DB, which hits the limit on the machine (6-7 Gbs/s).
- With 5 node cluster, the load on some of the machines was ~30% - resources utilization was not good, because of the DB throttling. Probably with some tuning, we could get similar results with less nodes in the cluster.
- ES uses a lot of CPU - in the example case it averages 5-6 CPU cores at 100% during the tests.
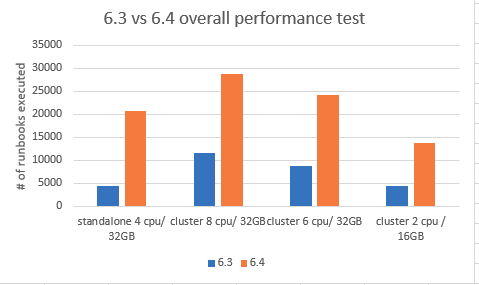
Figure 1 - 6.3 vs 6.4 performance tests
REST Performance Results
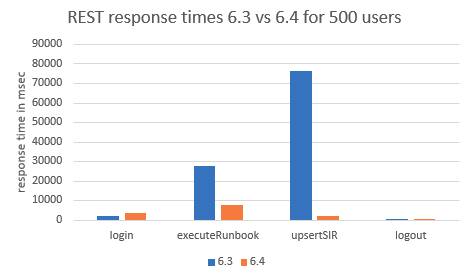
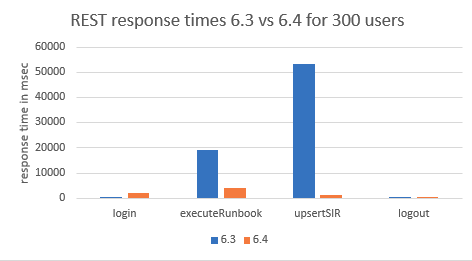
Figures 2 and 3- REST response times 6.3 vs. 6.4 for 500 users / REST response times 6.3 vs. 6.4 for 300 users

Figure 4 - SOAP response times 6.3 vs 6.4 for 1 user

Figure 5 - SOAP response times 6.3 vs 6.4 for 10 users

Figure 6 - SOAP response times 6.3 vs 6.4 for 20 users

Figure 7 - SOAP response times 6.3 vs 6.4 for 40 users

Figure 8 - SOAP response times 6.3 vs 6.4 for 300 users

Figure 9 - SOAP response times 6.3 vs 6.4 for 500 users
Performance Comparison With Previous Actions Pro Versions
Specific Runbook (40_Noop) was used to load RSControl only by eliminating any network I/O or external dependencies from third parties. The following test simulates high peak burst load to Actions Pro versions 6.3 and 6.4 running on a single VM. For high demand workloads, redundancy or in production environments we do NOT recommend running all Actions Pro components on a single VM.
Below is a rough comparison between Actions Pro v.6.3 and v.6.4 performed on a single VM (16 cores, 32GB RAM) executing the 40_Noop Runbook.
Table 5: Comparison results
| Actions Pro 6.3 | Actions Pro 6.4 | Actions Pro 7.0 | |
|---|---|---|---|
| RB/s | 7.84 | 36.92 | 38.09 |
| AT/s | 330 | 1550 | 1524 |
Table 6: Hardware requirements
| OS | CPU | Memory | HDD (storage) | HDD (provisioned IOPS) | Network interface |
|---|---|---|---|---|---|
| CentOS 8 | 16 | 32 | 500 | 1000 | 1 Gbit |
Table 7: JVM memory allocation per component
| Component | Xms | Xmx |
|---|---|---|
| RSSEARCH | 16384 | 16384 |
| RSMQ4 | ~23552 | ~23552 |
| RSVIEW | 2048 | 4096 |
| RSCONTROL | 2048 | 4096 |
| RSREMOTE | 2048 | 4096 |
| RSMGMT | 512 | 1024 |
| RSSYNC | 1024 | 1024 |
| RSARCHIVE | 2048 | 4096 |
| LOGSTASH | 1024 | 1024 |
The cluster layout consists of a Primary and Secondary instance of RSMQ, RSView. The Actions Pro components which scale horizontally in the following tests are RSControl, RSRemote and RSSearch data nodes.
Scaling improvements from previous Actions Pro versions
Table 8: Scaling to 5 and 10 or even 20 RSControl instances in comparison with Actions Pro v.6.3:
| Actions Pro 6.3 | Actions Pro 6.4 | Actions Pro 7.0 | |
|---|---|---|---|
| # of RSControls | 5 10 20 | 5 10 20 | 5 10 |
| RB/s | 16 23 - | 81 172 329 | 63 141 |
| AT/s | 3520 5060 | 17820 38184 73038 | 14092 31302 |
No data is available of Actions Pro v.6.3 on 20 nodes as beyond 10 nodes throughput actually degraded.
Table 9: In a real-world scenario results WILL vary in any direction
A good example is a customer's set of Runbooks provided and measured in a similar manner.
| Actions Pro 6.3 | Actions Pro 6.4 | |
|---|---|---|
| # ofRSControls | 3 5 10 | 5 10 |
| RB/s | 3.38 4.67 5 | 34.17 69.78 |
| AT/s | 750 1036 1110 | 7586 15491 |
The above tests take into account simulated network I/O wait time but latency to third party systems will influence the end results. The same should be taken into account when configuring Actions Pro for optimal performance.
High-Performance Cluster
Important changes were introduced in version 6.4 of Actions Pro to allow better scalability for high throughput demands. The following recommendations are only a guideline. The exact requirements may vary for each use case and should be adjusted accordingly. A high performing Actions Pro cluster deployment should include dedicated nodes for each component whenever possible. This is especially valid for RSMQ and RSSEARCH as they scale differently.
RSMQ is CPU intensive, but queues are single threaded and would run on low throughput disks with small pool of local storage. The number of CPU cores should be sized according to the number of RSControl/RSRemote nodes in the cluster. High performing deployment may require 16 CPU cores at 2.0Ghz or greater speed.
RSMQ CPU cores = # of RSControl nodes + 2
* Total number of RSControl nodes in a cluster
If possible, RSMQ servers should be dedicated to RSMQ and no other components should be present. For general usage, RSMQ is configured to flush messages to disk when it reaches 40% of the available physical memory on the server. The operation is I/O intensive and may severely impact further execution.
In extreme occasions under heavy peak load, slower disks or underprovisioned servers it may force a failover to the standby RSMQ instance. This could be safely tuned to 70% if no other components coexist leaving 30% of the available physical memory to OS for caching (vm_memory_high_watermark).
The RSMQ management by default shows message rates for each queue, channel and exchange. For best possible performance out of a CPU-bound server they can be disabled, f.e.:
RSSearch
For high load demand, RSSEARCH nodes can scale horizontally to 5 or more servers depending on the use case. A holistic approach is required to determine optimal settings. RSSEARCH nodes can be added to the cluster at runtime when needed. If heavy I/O is observed, we recommend RSSEARCH being tuned to fsync its transaction log on a set interval (fox example, 5 s).
RSControl
Tuning RSCONTROL is crucial to ensure optimal resource utilization across the cluster. Primary control mechanism to control the flow of work is achieved by the MAXEXECUTIONEVENTS property. Values may vary from 64 to 2048 depending on type of Runbooks, dependency on third parties etc. Load to Elasticsearch can be further offloaded by a enabling a bulk index processor controlled by the following properties in blueprint.properties:
- rssearch.concurrentrequests - enables/disables concurrent requests to the ElasticSearch search client that is being used for batching requests to ES.
- rssearch.bulkactions - number of entities kept in the ElasticSearch client before it flushes it to ES
- rssearch.bulksize - size in MB that will be kept in the ElasticSearch client before it flushes its content to ES
- rssearch.flushinterval - interval which ElasticSearch Bulk client will wait before it flushes its content to ES
Sample Actions Pro Cluster Layout For More Than 1 000 000 AT/m
The following is a sample layout of Actions Pro cluster to achieve a throughput of 1 000 000 AT/m. The setup below uses a total of 15 VMs with each Actions Pro component grouped to scaling RSSEARCH, RSCONTROL and RSREMOTE by adding instances of the same type. Use for reference - different automations or integrations with third parties may require different resources.
Table 10: Hardware requirements
| Group | Instance type | Actions Pro component | Instance count | CPU cores3 | Memory (GB) | Storage (GB) | Network interface |
|---|---|---|---|---|---|---|---|
| Group A | Dedicated1 | RSMQ | 2 | 16 | 32 | 500 | 1 Gbit |
| Group B | Dedicated1 | RSSEARCH, RSMGMT | 3 | 16 | 32 | 500 | 1 Gbit |
| Group C | Shared2 | RSCONTROL, RSREMOTE, RSMGMT | 7 | 8 | 8 | 500 | 1 Gbit |
| Group D | Shared2 | RSCONTROL, RSREMOTE, RSMGMT, RSVIEW | 2 | 8 | 16 | 500 | 1 Gbit |
| Group E | Shared2 | RSCONTROL, RSREMOTE, RSMGMT, RSSYNC, RSARCHIVE, LOGSTASH | 1 | 8 | 24 | 500 | 1 Gbit |
Table 11: Components grouped by instance type
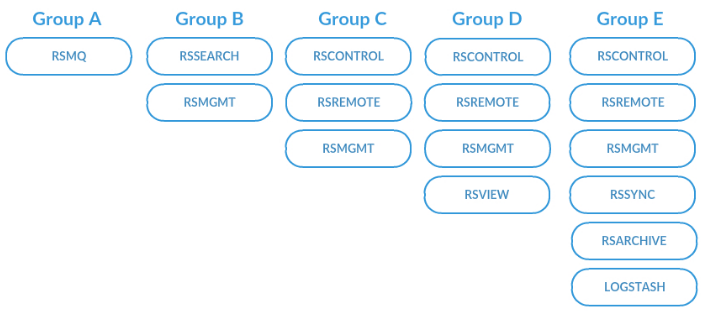
Table 12: JVM memory allocation per component
| Component | Xms | Xmx |
|---|---|---|
| RSSEARCH | 16384 | 16384 |
| RSMQ4 | ~23552 | ~23552 |
| RSVIEW | 2048 | 4096 |
| RSCONTROL | 2048 | 4096 |
| RSREMOTE | 2048 | 4096 |
| RSMGMT | 512 | 1024 |
| RSSYNC | 1024 | 1024 |
| RSARCHIVE | 2048 | 4096 |
| LOGSTASH | 1024 | 1024 |
The setup above has been confirmed to support up to 20 RSCONTROL instances with 5 RSSEARCH nodes before it starts saturating the 1Gbit link.
Sample Actions Pro Cluster Layout For 500 000 AT/m
The following is a sample layout of Actions Pro cluster to achieve a throughput of 500 000 AT/m. The setup below uses a total of 10 VMs with each Actions Pro component grouped to scaling RSSEARCH, RSCONTROL and RSREMOTE by adding instances of the same type . Use for reference - different automations or integrations with third parties may require different resources.
Table 13: Hardware requirements
| Group | Instance type | Actions Pro component | Instance count | CPU cores3 | Memory (GB) | Storage (GB) | Network interface |
|---|---|---|---|---|---|---|---|
| Group A | Dedicated1 | RSMQ | 2 | 16 | 32 | 500 | 1 Gbit |
| Group B | Dedicated1 | RSSEARCH, RSMGMT | 3 | 16 | 32 | 500 | 1 Gbit |
| Group C | Shared2 | RSCONTROL, RSREMOTE, RSMGMT | 2 | 8 | 8 | 500 | 1 Gbit |
| Group D | Shared2 | RSCONTROL, RSREMOTE, RSMGMT, RSVIEW | 2 | 8 | 16 | 500 | 1 Gbit |
| Group E | Shared2 | RSCONTROL, RSREMOTE, RSMGMT, RSSYNC, RSARCHIVE, LOGSTASH | 1 | 8 | 24 | 500 | 1 Gbit |
- Instance type : Dedicated
Table 14: Components grouped by instance type
Table 15: JVM memory allocation per component
| Component | Xms | Xmx |
|---|---|---|
| RSSEARCH | 16384 | 16384 |
| RSMQ4 | ~23552 | ~23552 |
| RSVIEW | 2048 | 4096 |
| RSCONTROL | 2048 | 4096 |
| RSREMOTE | 2048 | 4096 |
| RSMGMT | 512 | 1024 |
| RSSYNC | 1024 | 1024 |
| RSARCHIVE | 2048 | 4096 |
| LOGSTASH | 1024 | 1024 |
High Availability Configuration
The typical High Availability configuration has three times more CPUs (typically 12). The built-in High Availability module can distribute the load evenly among several hosts which leads to a much larger system capacity. It generally runs on a cluster of three hosts and provides additional benefits such as higher tolerance to failure and flexibility for configuration.
Important changes were introduced in version 6.4 of Actions Pro to allow better scalability for high throughput demands. The following recommendations are only a guideline. The exact requirements may vary for each use case and should be adjusted accordingly. A high performing Actions Pro cluster deployment should include dedicated nodes for each component whenever possible. This is especially valid for RSMQ and RSSEARCH as they scale differently.
RSMQ is CPU intensive, but queues are single threaded and would run on low throughput disks with small pool of local storage. The number of CPU cores should be sized according to the number of RSControl/RSRemote nodes in the cluster. High performing deployment may require 16 CPU cores at 2.0Ghz or greater speed.
RSMQ CPU cores = # of RSControl nodes + 2
* Total number of RSControl nodes in a cluster
If possible, RSMQ servers should be dedicated to RSMQ and no other components should be present. For general usage, RSMQ is configured to flush messages to disk when it reaches 40% of the available physical memory on the server. The operation is I/O intensive and may severely impact further execution.
In extreme occasions under heavy peak load, slower disks or underprovisioned servers it may force a failover to the standby RSMQ instance. This could be safely tuned to 70% if no other components coexist leaving 30% of the available physical memory to OS for caching (vm_memory_high_watermark).
The RSMQ management by default shows message rates for each queue, channel and exchange. For best possible performance out of a CPU-bound server they can be disabled, f.e.:
RSSearch
For high load demand, RSSEARCH nodes can scale horizontally to 5 or more servers depending on the use case. A holistic approach is required to determine optimal settings. RSSEARCH nodes can be added to the cluster at runtime when needed. If heavy I/O is observed, we recommend RSSEARCH being tuned to fsync it's transaction log on a set interval (for example, 5s).
RSControl
Tuning RSCONTROL is crucial to ensure optimal resource utilization across the cluster. Primary control mechanism to control the flow of work is achieved by the MAXEXECUTIONEVENTS property. Values may vary from 64 to 2048 depending on type of Runbooks, dependency on third parties etc. Load to Elasticsearch can be further offloaded by a enabling a bulk index processor controlled by the following properties in blueprint.properties:
- rssearch.concurrentrequests - enables/disables concurrent requests to the ElasticSearch search client that is being used for batching requests to ES.
- rssearch.bulkactions - number of entities kept in the ElasticSearch client before it flushes it to ES
- rssearch.bulksize - size in MB that will be kept in the ElasticSearch client before it flushes its content to ES
- rssearch.flushinterval - interval which ElasticSearch Bulk client will wait before it flushes its content to ES
Sample Actions Pro Cluster Layout For More Than 1 000 000 AT/m
The following is a sample layout of Actions Pro cluster to achieve a throughput of 1 000 000 AT/m. The setup below uses a total of 15 VMs with each Actions Pro component grouped to scaling RSSEARCH, RSCONTROL and RSREMOTE by adding instances of the same type. Use for reference - different automations or integrations with third parties may require different resources.
Table 16: Hardware requirements
| Group | Instance type | Actions Pro component | Instance count | CPU cores3 | Memory (GB) | Storage (GB) | Network interface |
|---|---|---|---|---|---|---|---|
| Group A | Dedicated1 | RSMQ | 2 | 16 | 32 | 500 | 1 Gbit |
| Group B | Dedicated1 | RSSEARCH, RSMGMT | 3 | 16 | 32 | 500 | 1 Gbit |
| Group C | Shared2 | RSCONTROL, RSREMOTE, RSMGMT | 7 | 8 | 8 | 500 | 1 Gbit |
| Group D | Shared2 | RSCONTROL, RSREMOTE, RSMGMT, RSVIEW | 2 | 8 | 16 | 500 GB | 1 Gbit |
| Group E | Shared2 | RSCONTROL, RSREMOTE, RSMGMT, RSSYNC, RSARCHIVE, LOGSTASH | 1 | 8 | 24 | 500 | 1 Gbit |
Table 17: Components grouped by instance type
Table 18: Hardware requirements
| Group | Instance type | Actions Pro component | Instance count | CPU cores3 | Memory (GB) | Storage (GB) | Network interface |
|---|---|---|---|---|---|---|---|
| Group A | Dedicated1 | RSMQ | 2 | 16 | 32 | 500 | 1 Gbit |
| Group B | Dedicated1 | RSSEARCH, RSMGMT | 3 | 16 | 32 | 500 | 1 Gbit |
| Group C | Shared2 | RSCONTROL, RSREMOTE, RSMGMT | 2 | 8 | 8 | 500 | 1 Gbit |
| Group D | Shared2 | RSCONTROL, RSREMOTE, RSMGMT, RSVIEW | 2 | 8 | 16 | 500 GB | 1 Gbit |
| Group E | Shared2 | RSCONTROL, RSREMOTE, RSMGMT, RSSYNC, RSARCHIVE, LOGSTASH | 1 | 8 | 24 | 500 | 1 Gbit |
Table 19: JVM memory allocation per component
| Component | Xms | Xmx |
|---|---|---|
| RSSEARCH | 16384 | 16384 |
| RSMQ4 | ~23552 | ~23552 |
| RSVIEW | 2048 | 4096 |
| RSCONTROL | 2048 | 4096 |
| RSREMOTE | 2048 | 4096 |
| RSMGMT | 512 | 1024 |
| RSSYNC | 1024 | 1024 |
| RSARCHIVE | 2048 | 4096 |
| LOGSTASH | 1024 | 1024 |
Optimization, Monitoring, and Future Planning
Optimization
Depending on the Runbook design or the number of concurrent users, different components of Actions Pro will have a different degree of load, which means that certain optimization may be required.
Monitoring
Actions Pro performance should be continuously monitored and periodically re-evaluated to detect any issue with the current setup. It is also necessary for extrapolating performance trends to assist with future capacity planning. It is recommendable for customers to perform:
- Benchmark testing when Actions Pro is installed
- Updated or upgraded
- When the initial set of Runbooks is deployed
- After a major feature, such as archiving is turned on, or on an average of every three months.
The following metrics are important for gauging performance and planning for future capacity. Actions Pro provides this information under "Admin Reports".
- Server Load Average Over 1, 5, 15 minutes - The Server Load Average is one of the key indicators of Actions Pro capacity. The system is overloaded if the load average is higher than the number of CPUs indicated by the operating system (e.g. cat /proc/cpuinfo). Generally, Actions Pro should run at 30-40% load to allow for burst execution loads from event storms, etc.
- The Transaction Count indicates the volume of executions processed. It can be used to trend usage loads for capacity planning as well as identifying burst ratios (peak/average load) load profiles. The burst ratio is useful to determine required overhead capacity to manage burst traffic loads.
- The Runbook (startup) Latency indicates the average time taken to start the execution of automations. If this value is consistently increasing, it could indicate that the server may not have sufficient resources. Correlated with Load Average and Transaction Count, it is a good indicator of near-term capacity.
- Check if JVM memory allocated is close to the limit. Be sure to allow for when bursts occur in execution load which may cause the component to get Out-Of-Memory (OOM). This is one of the key tuning parameters to configure for new deployments and major changes in execution load profiles.
- Thread Count – JVM is typically the maximum thread pool size. The system maximum thread pool size do not need to be adjusted unless there is heavy load and the system needs to be optimized for better efficiency. Increasing both values will typically provide more concurrency and performance. However, beyond a certain optimal threshold, the performance will degrade.
- Active Users / Average Response Time - If there is a large number of Actions Pro users or the number of concurrent users is growing, it may be necessary to monitor the number of Active Users and ensure that Average Response Time does not increase beyond acceptable thresholds.
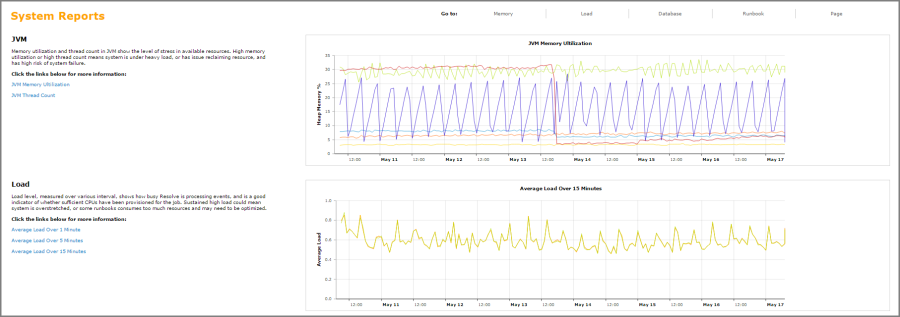
Figure 10: Sample Admin Reports
Future Planning
To plan for future capacity, the following factors should be taken into consideration:
- All the factors discussed above that could impact performance.
- Will any of the factors change?
- Is every assumption still valid?
- Performance of existing Actions Pro system.
- The latest performance benchmark provides actual performance when compared to what was used in the initial planning.
- Are the initial expectations similar to the actual benchmark?
- Change to existing Actions Pro configuration. You must take into account any ancillary tasks that will be activated, such as archiving, due to larger data set.
- Change to the environment that Actions Pro operates.
- Is there any new system that Actions Pro has to work with?
- Is there any existing system that has grown in size?
Summary
Capacity planning is better executed when holistic approach is applied. The historical records of performance benchmark provide the best guidance on how to scale up. To minimize risk of under-provisioning, it is recommendable to take incremental steps in introducing changes, and adjust capacity based on the updated performance metrics.
- It is recommended that no other components are setup on the RSMQ server for high throughput. If possible adjust vm_memory_high_watermark to 70% or ~23GB off of 32GB available memory.↩
- Multiple Actions Pro components can co-exist on the same server.↩
- Single Actions Pro component should be deployed↩
- CPU cores at 2.0Ghz or greater speed.↩